 Educational Systems Theory
 Educational Systems Theory

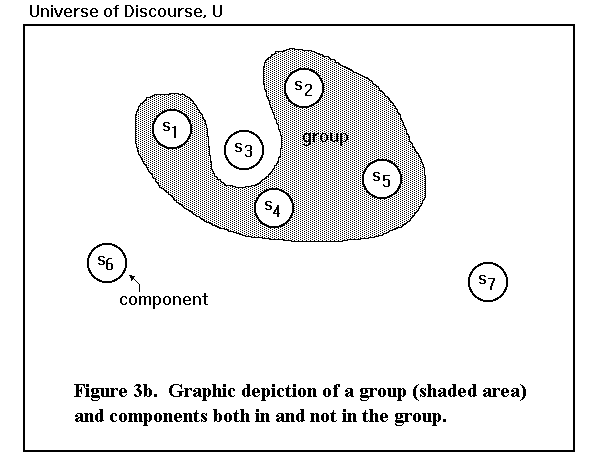
3.2. Analogous terms in set theory are 'set', 'elements', and the 'universal set'. In Figure 3b, Components s1, s4, s2 and s5 form a group. components s6, s3 and s7 are not in the group.

4.2. We can characterize things in many ways,
normally by using 'signs' to refer to things,
persons, places, events, etc. 'Signs' can be
symbolic/abstract such as spoken or written words,
but can also be icons, gestures, facial expressions,
mime, demonstration by enactment, touch, etc. Some
signs we use in education are 'teacher' (for one who
guides the learning of another) and 'student' (for
one who is attempting to learn).
5.2. The notion of information is very specific
here. "'information',
'I', equals by definition 'characterization, CH,
such that CH is equal to a set of categories, c,
such that that probability distribution, p, such
that the pair of c and the real number, v, (c,v), is
an element of p'." (p. 40)
5.3. For example, suppose we have four categories of
roles in education: teacher, student,
administrator, and staff. Suppose in some education system we have 9
teachers, 11 administrators (parent volunteers,
serving as a board of directors), 2 staff members
and 150 students (total of 172 persons). We can
compute relative frequencies to estimate the
probability distribution of person-roles:
p(teacher)= 9/172 = .05; p(administrator) = 11/172
= .06; p(staff) = 2/172 = .01; p(student) = 150/172
= .87.
5-1.2. This means that there is uncertainty.
Thus, there must be at least one category which has
a probability that is not equal to zero or one. In
the above example, this is true. The information about the set of
person roles is {(teacher,.05), (administrator,.06),
(staff,.01), (student,.87)}. There is uncertainty
in the probability distribution. If we were to
visit this school, the most likely person we would
observe is a student. However, we will occasionally
meet others such as teachers and parent board
members. On the other hand, if every person was a
student (probability = 1.0), then there is no selective information --
no uncertainty of category occurrences.
We can measure degree of uncertainty in a
probability distribution with H, from information theory. H is
maximum when categories are equiprobable. H is
minimum when one category has a probability of
occurrence of one and all others zero.
5-1-1.2. This is akin to the notion of independence
in probability theory. Suppose we have two
classifications: Person's Role and Ethnicity.
Suppose our categories of ethnicity are:
African-American, Anglo, Asian, Hispanic and Other.
We could obtain a distribution of persons according
to their ethnicity. If the p(Hispanic) = a, if the
p(administrator) = b, if the p(Hispanic and
administrator) = a b, and if this is true of all
pairs of roles ethnicity, then we would say that
the two probability distributions are independent.
In other words, the role taken by a person does not
depend on his or her ethnicity.
For example, the probability of being an
Hispanic person and an administrator is 0.20 x 0.06,
which is equal to 0.012. The same is true for
African Americans.
5-1-2.2. In this case there is a statistical
dependence. Each cell probability is no longer
equal to the product of its marginal probabilities,
as it is for nonconditional selective
information. Notice for example, if all administrators are Anglo, then no
administrators are from African-American, Asian,
Hispanic or Other ethnic backgrounds.
Note that here the probability of being
and African-American and an administrator is 0.000
(not 0.012 as above for nonconditional selective
information). If you are an African-American in
this example, you are not going to serve in the role
of administrator. This is conditional selective
information.
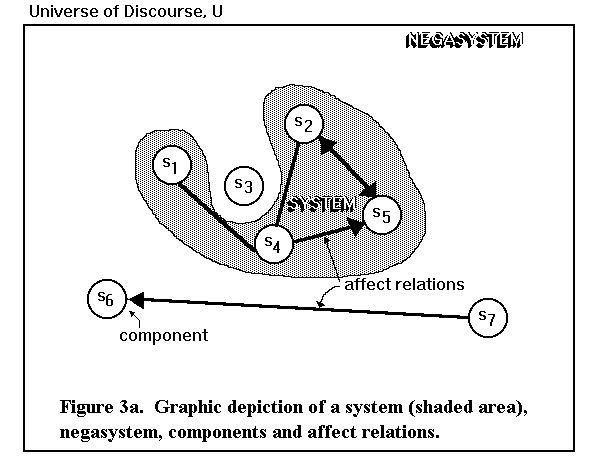
7-1.2. In the above figure directed affect relations
exist between (s7,s6), (s4,s5), (s4,s2), (s2,s5),
and (s5,s2).
7-1-1.2. In the above figure the direct directed affect
relations are: (s7,s6), (s4,s5), (s2,s5), and
(s5,s2).
7-1-2.2. In the above figure, the indirect directed affect
relation is (s4,s2). The channel is through s5.
4. Characterization
5. Information
5-1. Selective
Information
5-1-1. Nonconditional
Selective Information
5-1-2. Conditional
Selective Information
6. Transmission of
Selective Information
7. Affect Relation
Illustration:

7-1. Directed Affect
Relation
7-1-1. Direct Directed
Affect Relation
7-1-2. Indirect Directed
Affect Relation
 Go to SIGGS Home Page.